








An IT business that runs on power, around the clock
CAE Technology Services keeps other businesses running, servers, infrastructure, the systems people rely on without ever thinking about them. That mission takes serious, constant electricity, and it had become one of the biggest running costs the company carried, keeping the racks and the lights on. As that bill climbed, CAE wanted more than a smaller invoice. They wanted predictable costs, and a way to put money back into growth and their mission instead of straight into the grid.
Money straight out of growth, every year
Every pound going to grid electricity was a pound not going into people, service, or growth. For a company built on efficiency, that was the one line that kept climbing and never worked harder for them. The real question wasn't whether to act, it was how to cut it without disrupting an IT operation that simply can't afford downtime.
A 24.6 kW system, sized to the load
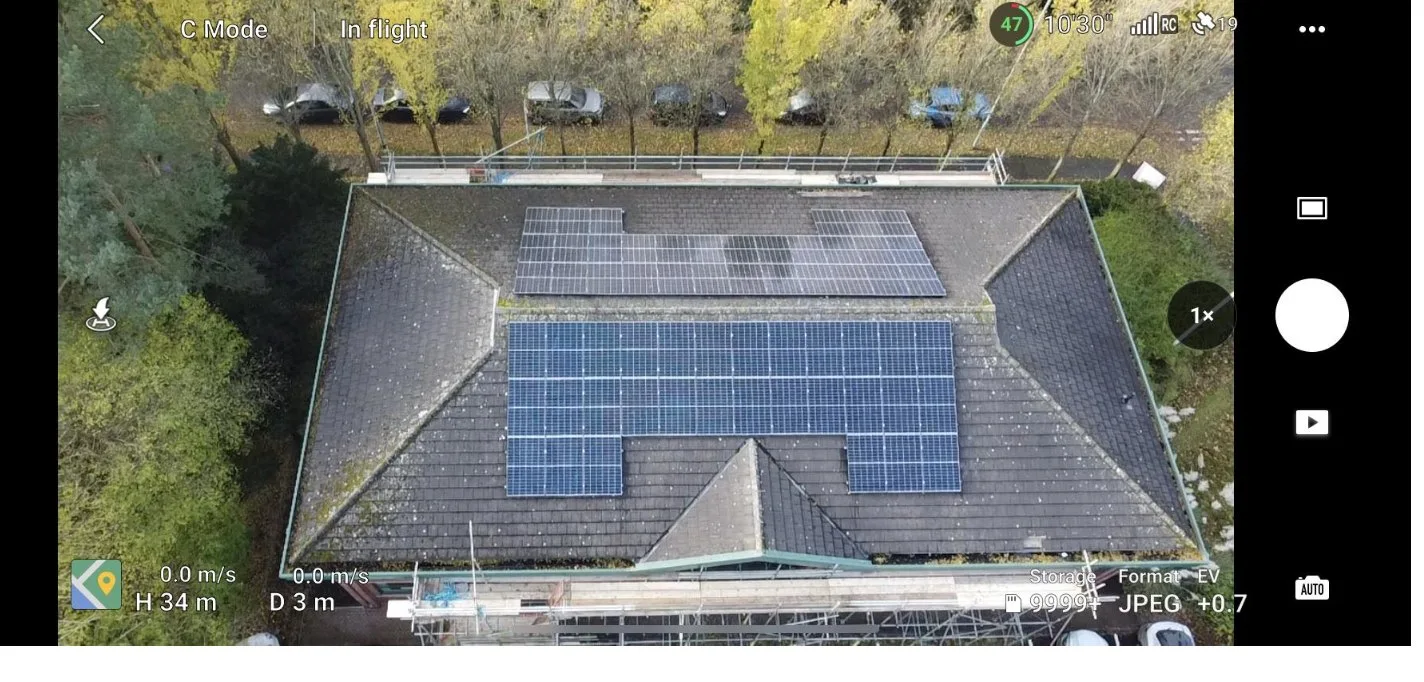
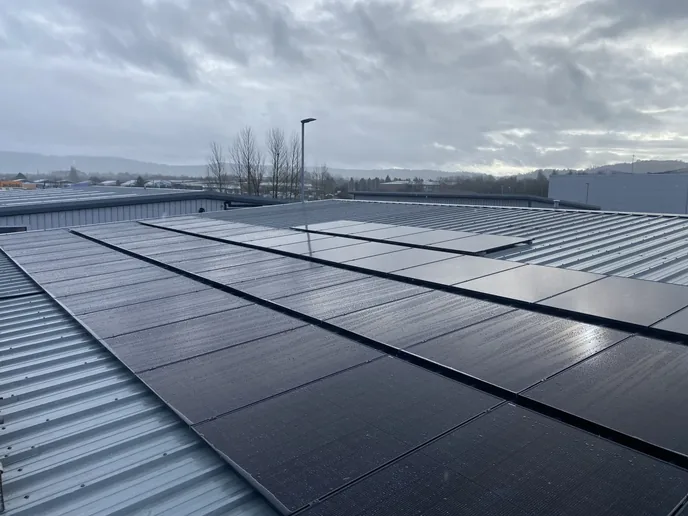
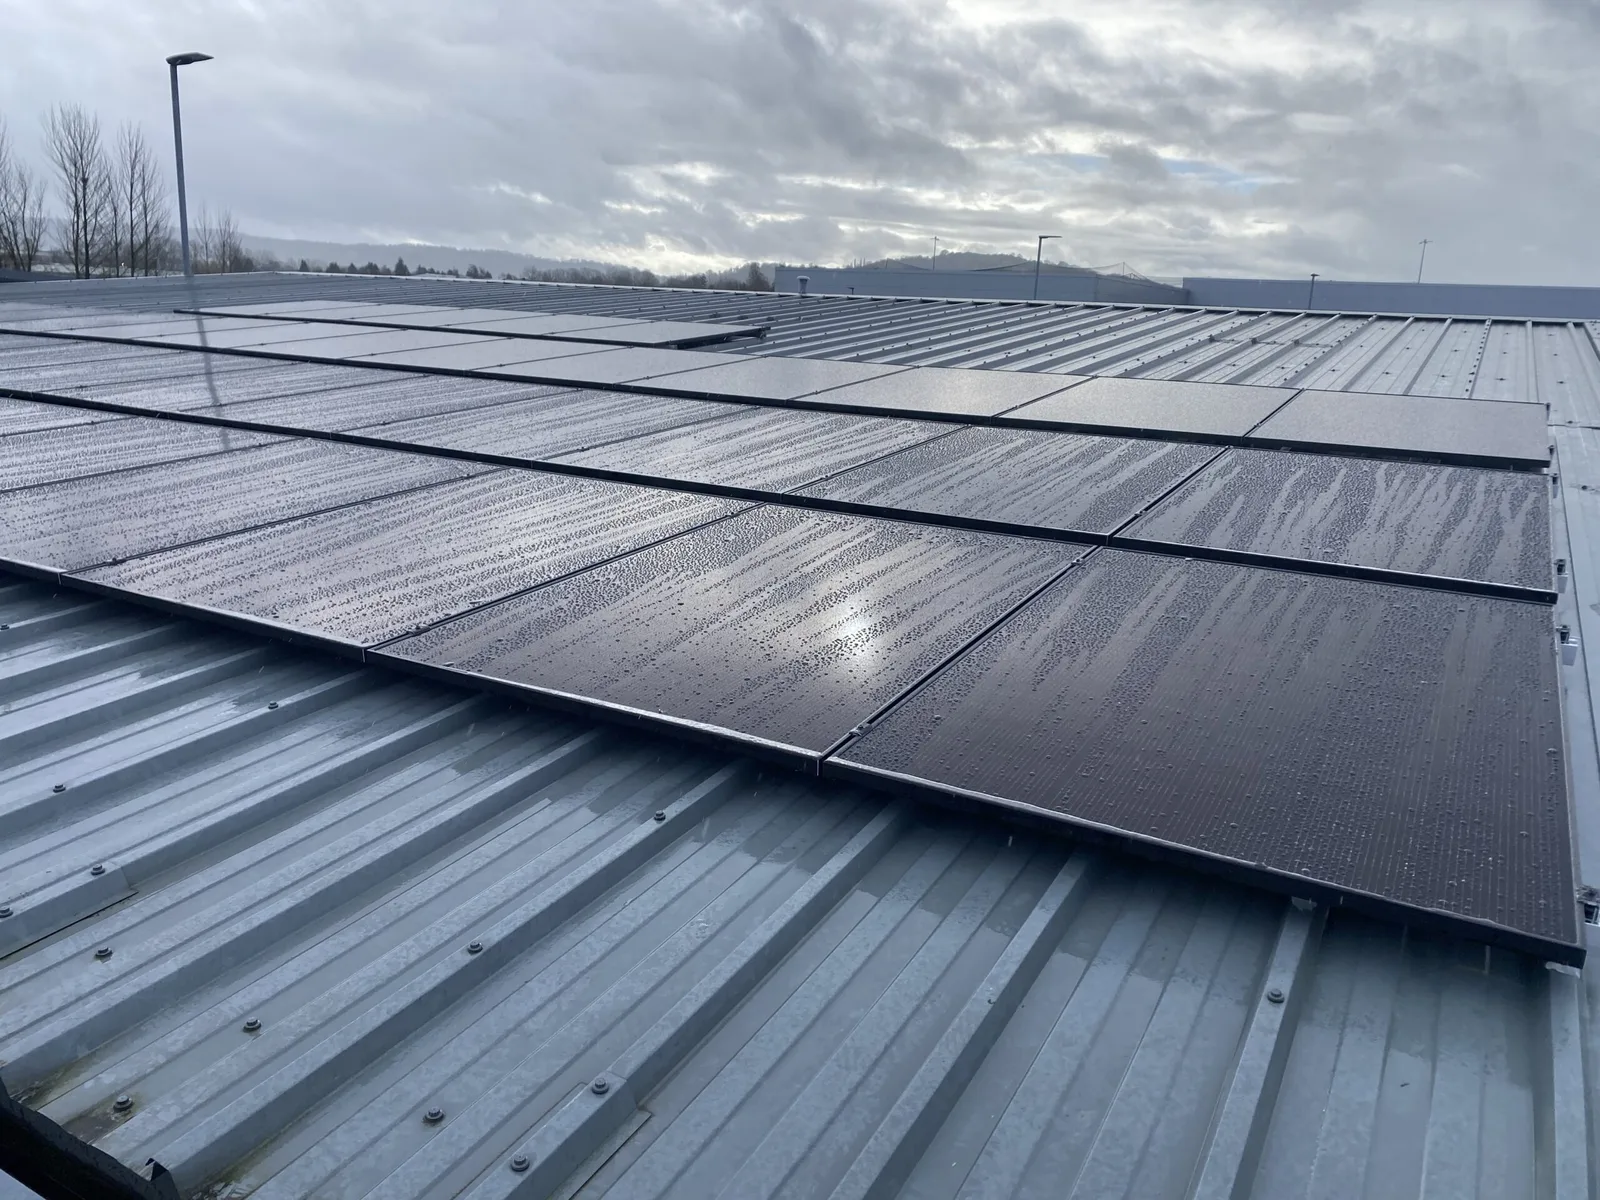
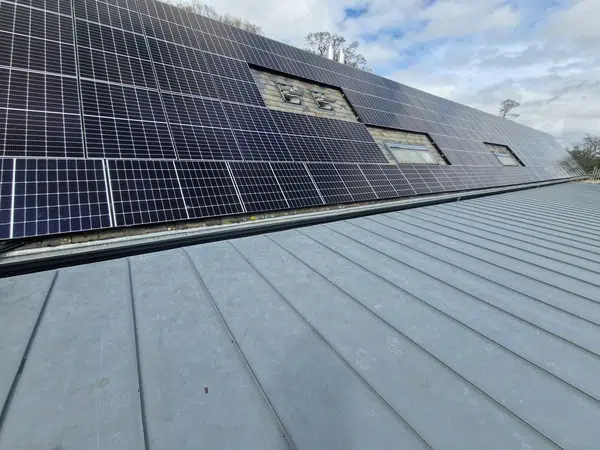
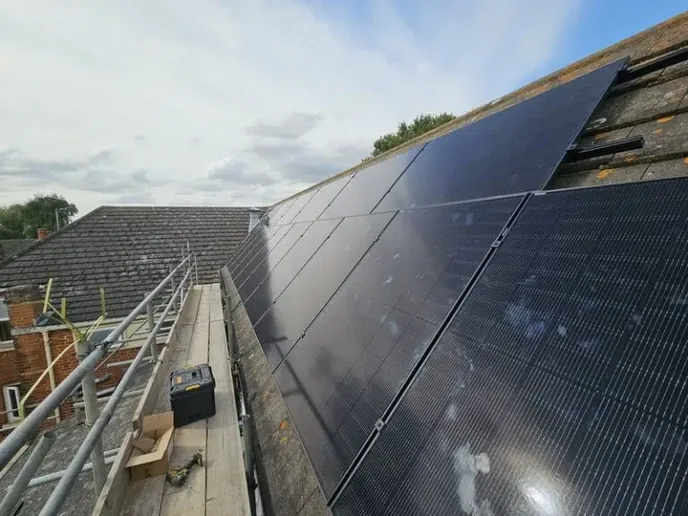
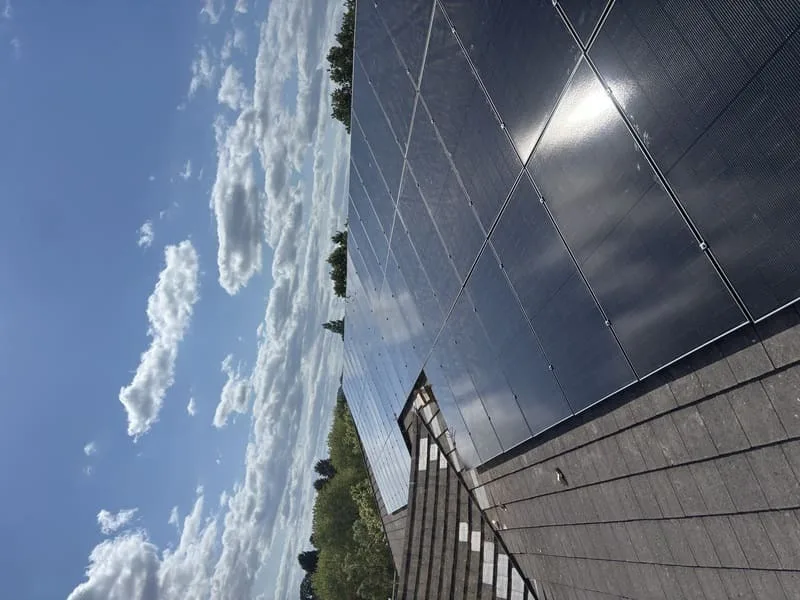
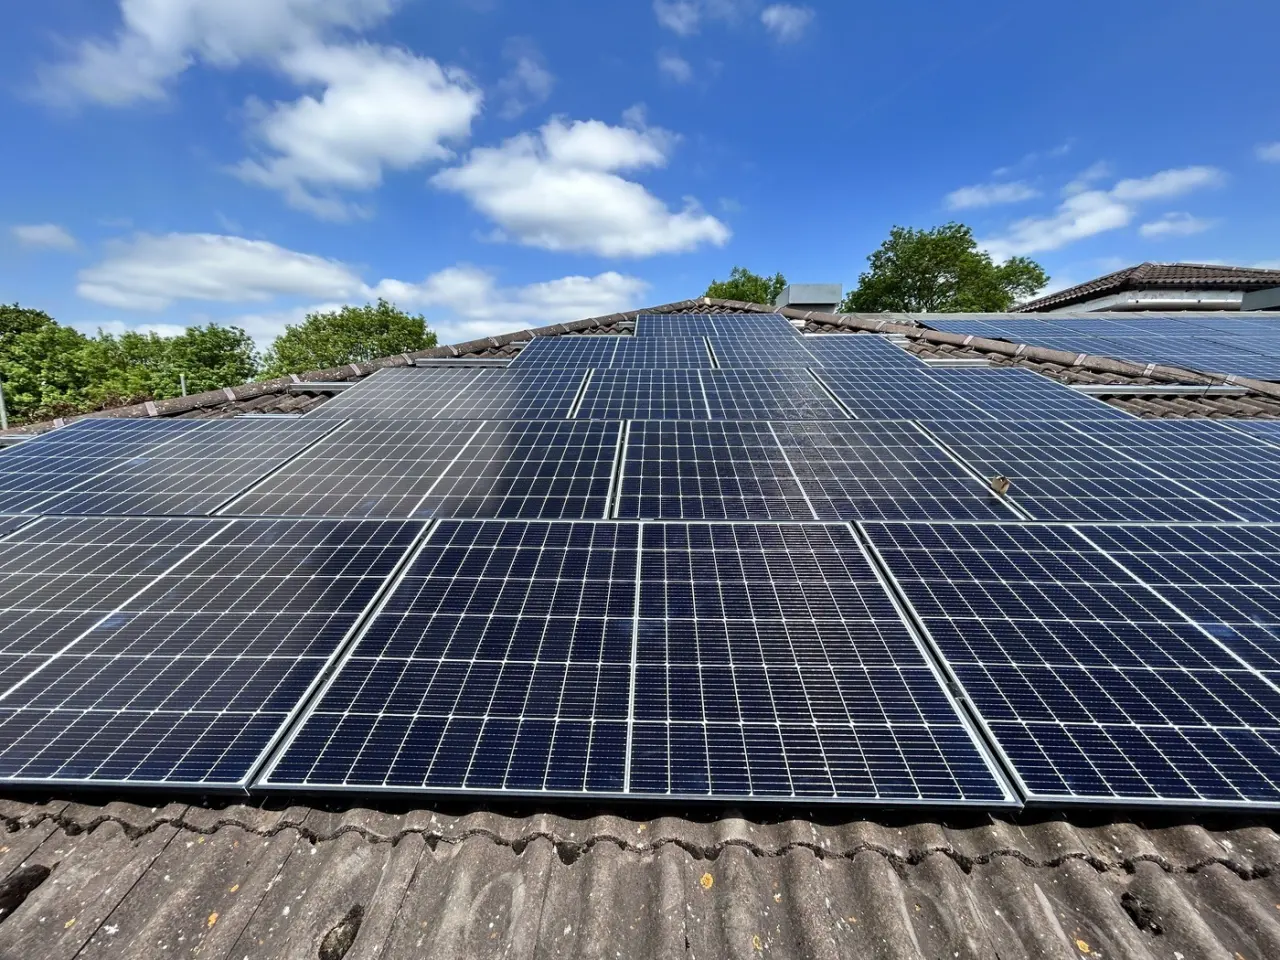
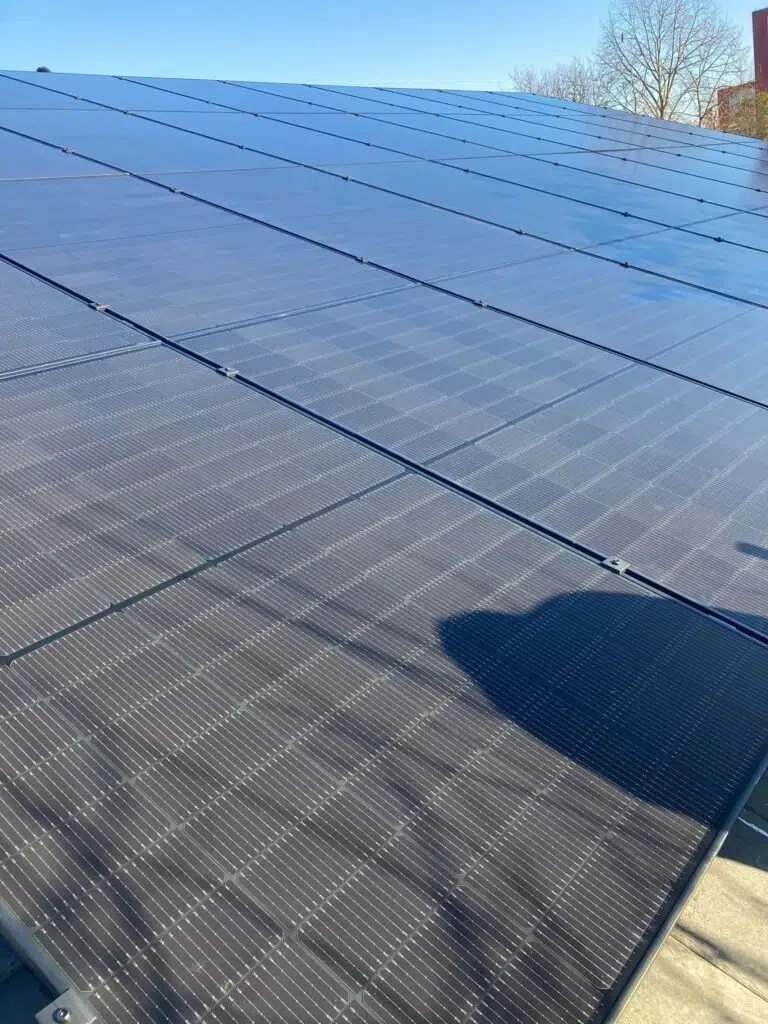
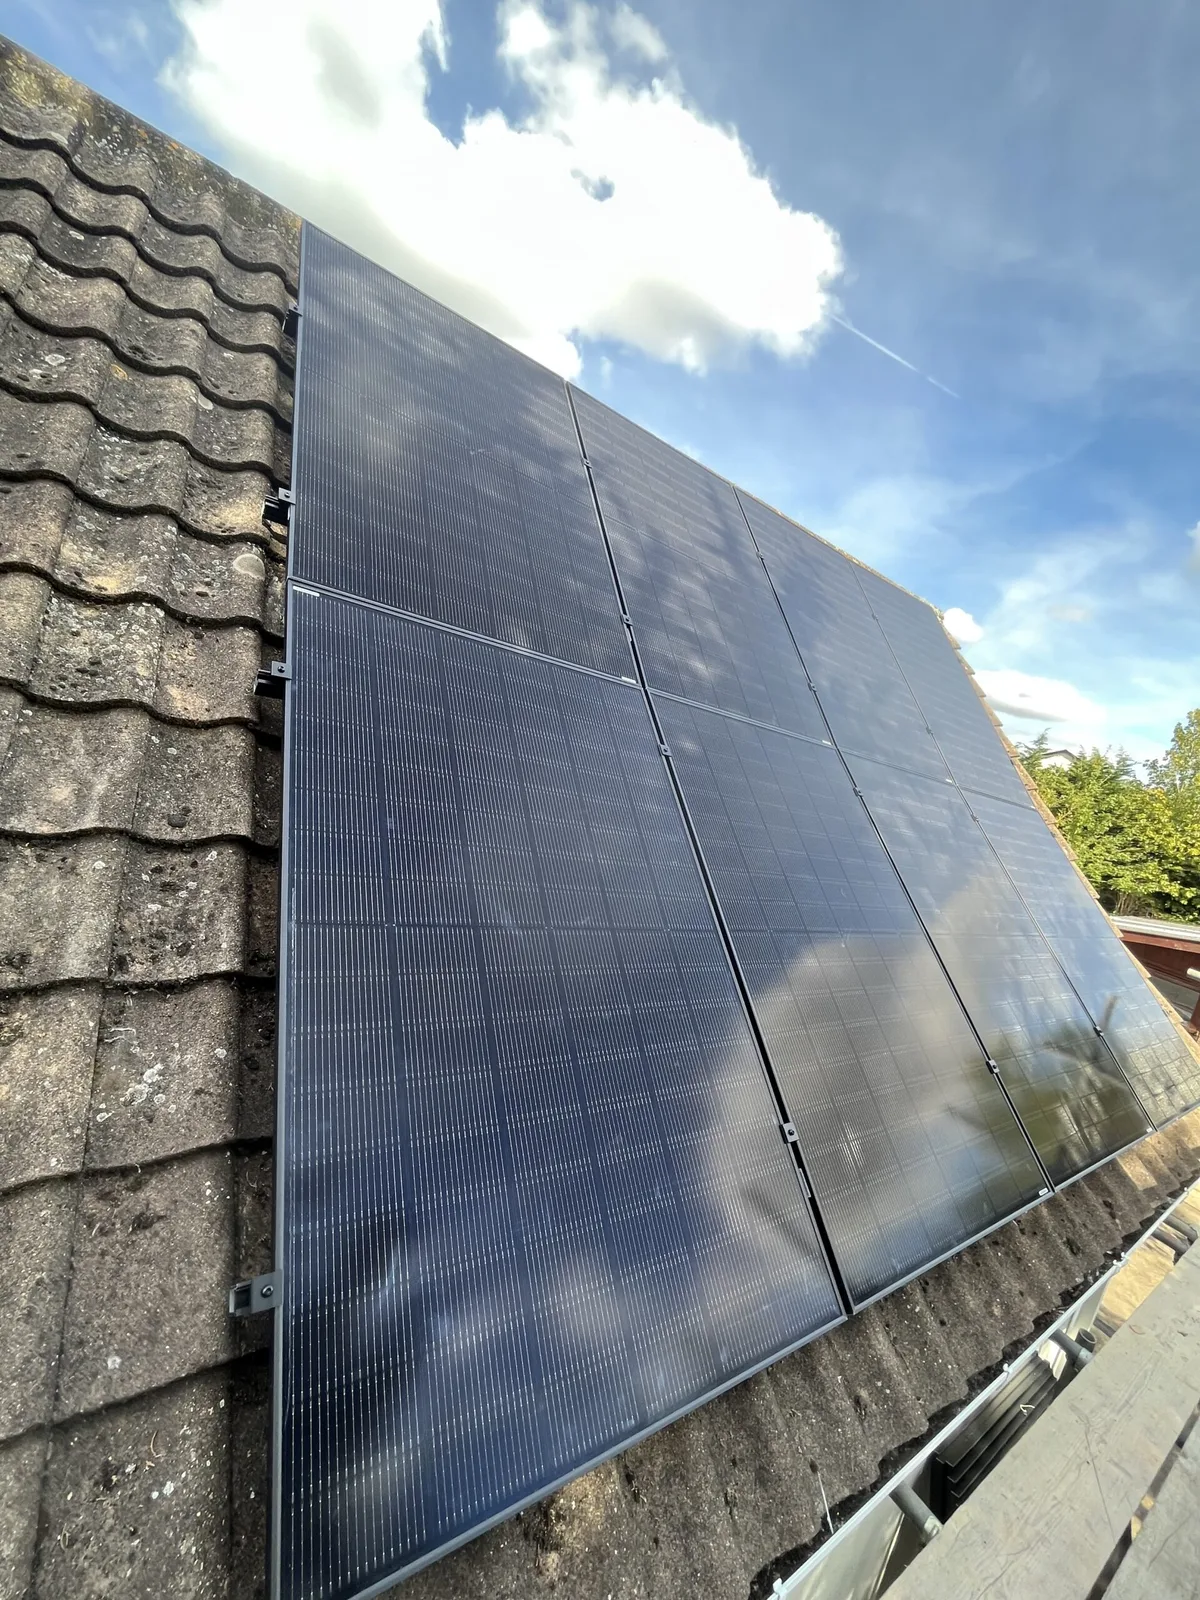
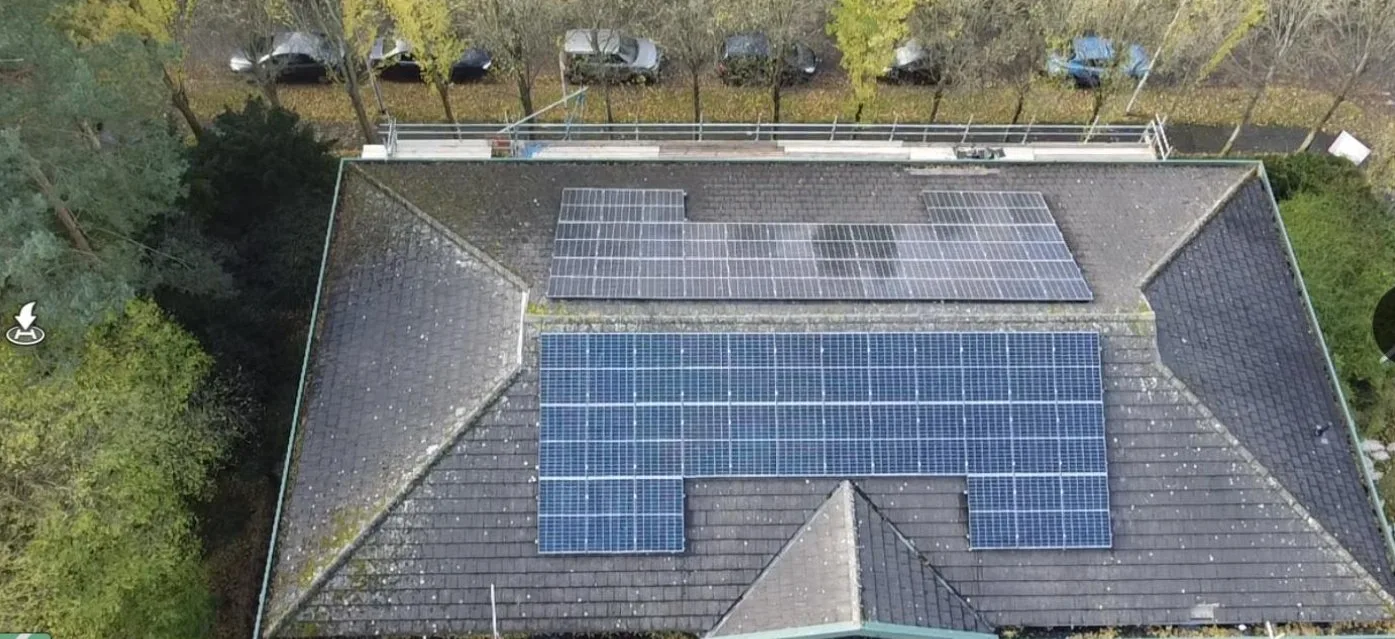
We didn't sell CAE a number off a shelf, we designed a 24.6 kW rooftop system, around 58 panels, matched to how the business actually uses power: heavily, and in daylight. We ran the whole job end to end, from site visit and design through to install and commissioning, and scheduled it around the business so the IT operation never skipped a beat.
- ~58 panels (24.6 kW total), sized to CAE’s daytime demand
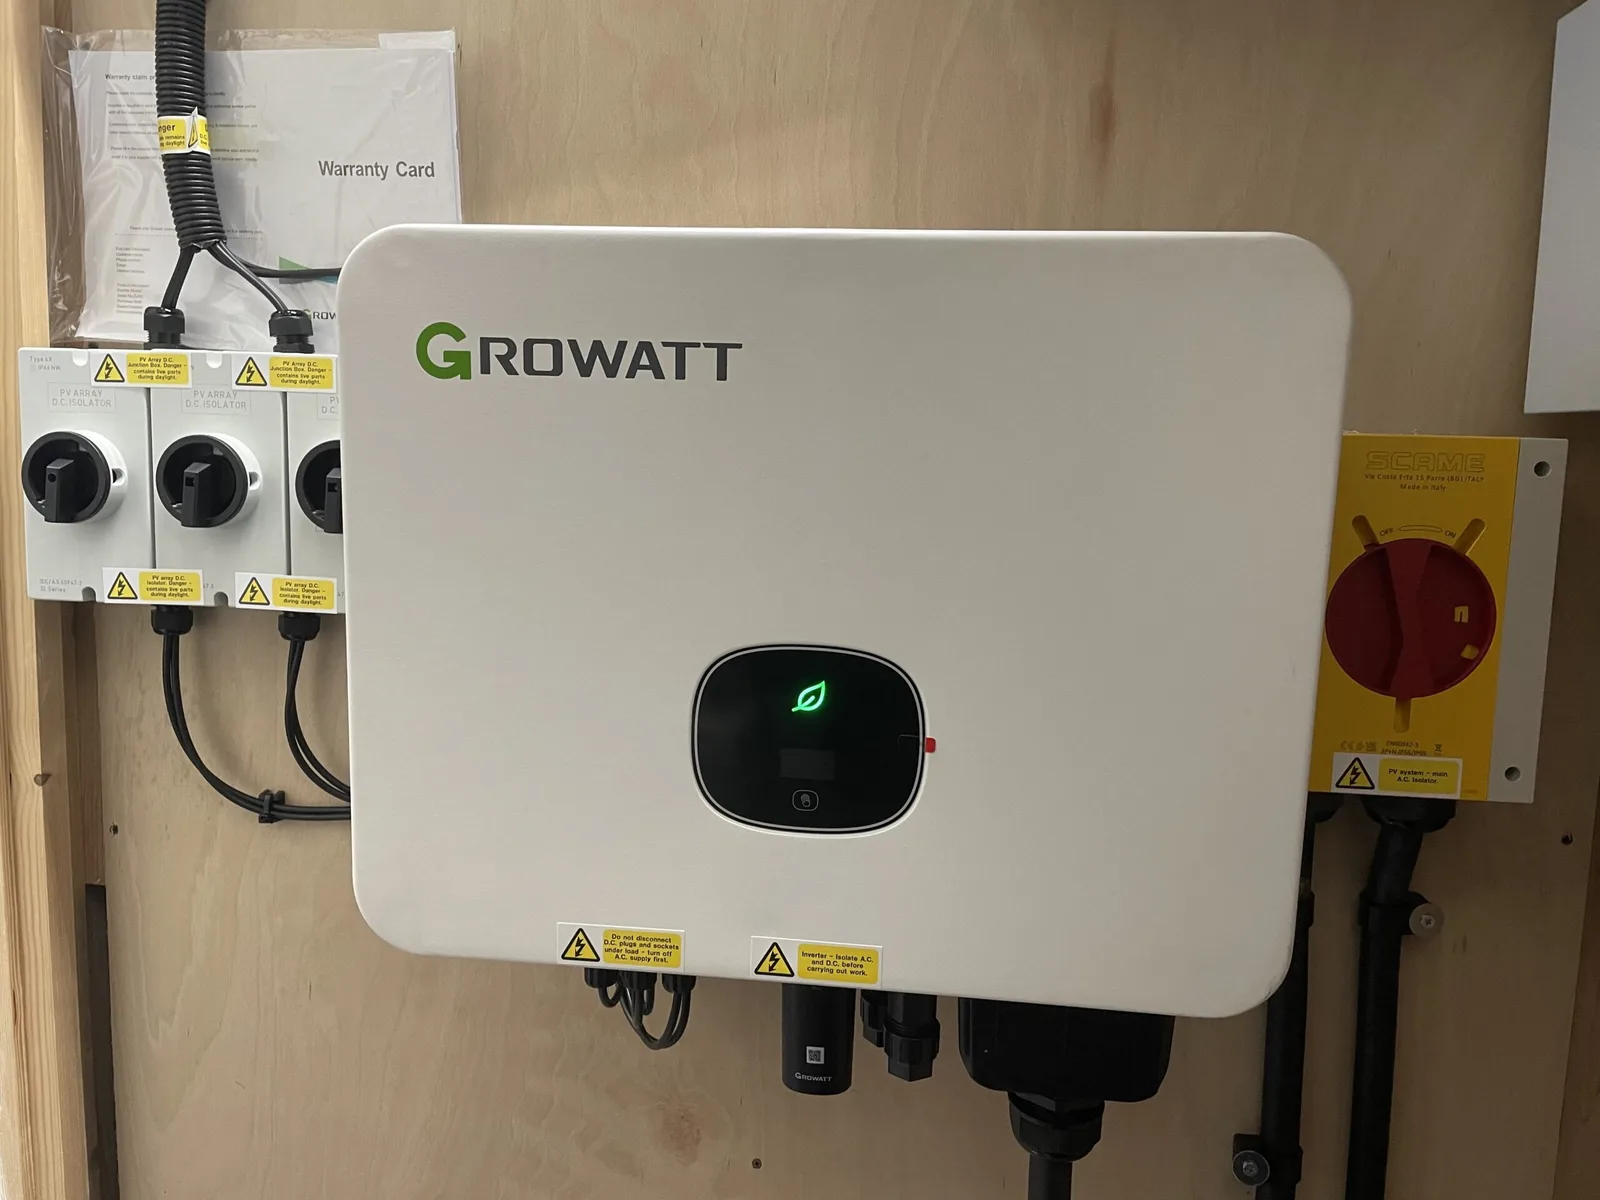
- Commercial inverter + monitoring
- Designed to generate in the same daytime hours CAE draws the most power
- Installed around a live IT operation with zero downtime, future-proofed for battery
A 69% cut, straight off the bill
CAE’s electricity bill fell by close to 69%. The system generates an estimated ~22,000 kWh a year and avoids around 4.5 tonnes of CO₂ annually (both estimated from the 24.6 kW system size and UK yield). Money that used to leave the building now stays in it, in the same daylight hours the business runs hardest. Over the system’s 25-year life that is roughly £92,000 to £123,000, on an install that typically pays for itself in five to six years.
Generation and saving figures on this page are estimates, modelled from the system size and a typical UK yield. They are not meter readings. Your own figures depend on your roof, your usage and the weather in any given year, and we confirm them from a real assessment rather than a model.